
By: Sharada Kalanidhi
Technical Director, WiDS Datathon
At the WiDS 2024 Datathon challenge #1, we are studying Triple Negative Breast cancer. This is an important and potentially fatal condition facing women around the world. Our dataset consists of variables that are tracked by pharmaceutical companies (Gilead) as well as demographic, economic and air toxicology data that might affect the outcome of prompt diagnosis. In this tutorial, I will walk you through the basic steps of exploratory data analysis, and help you set up your dataset for machine learning.
One of the first steps you might want to do is identify the quantitative and categorical variables in the dataset. Next, compute a quantitative summary of the variables and see how the averages vary as the categorical outcomes change. R has some great packages for these basic steps, as shown below.
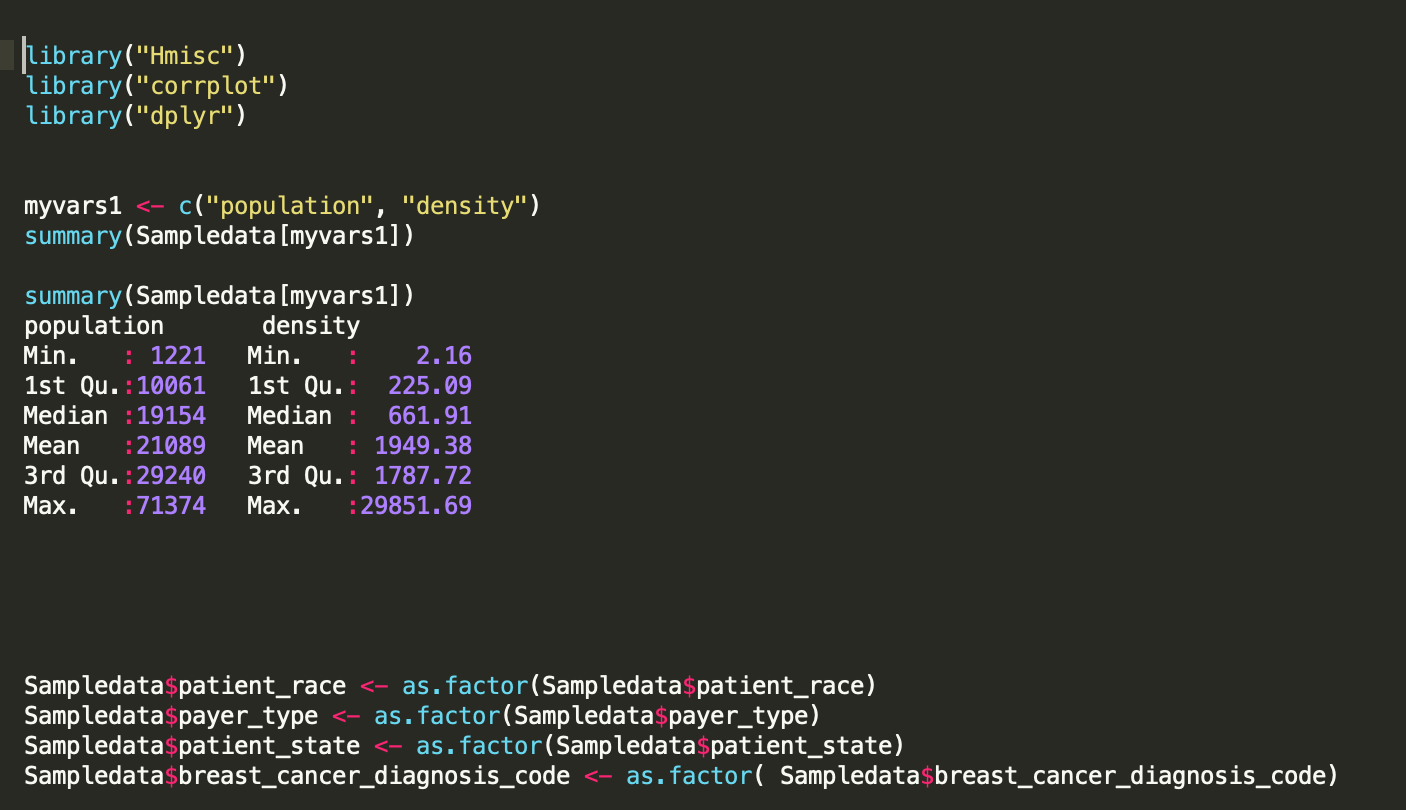
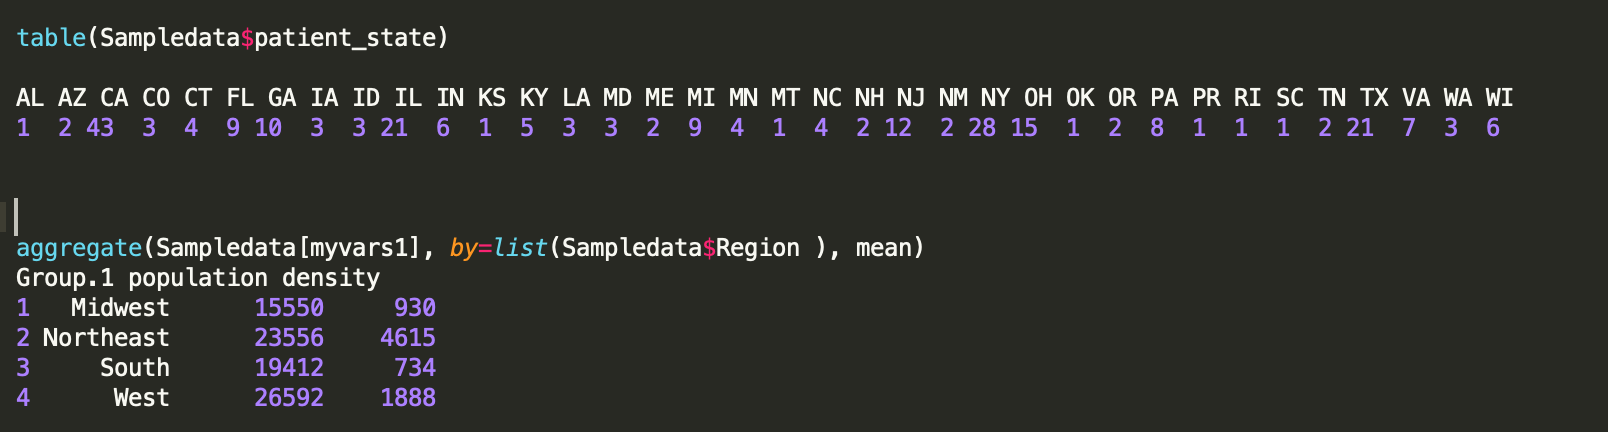
Here I am computing the summary mean by Region for a sample of the data. I am also using “table” function in R to get a count of rows in each state.
I typically take a 3-step approach towards EDA. I try to understand:
a) the Univariate Distributions of key variables
b) the Bivariate relationships among key quantitative variables – and how those relationships might change as the outcome changes
c) any correlations and multivariate relationships that might exist in the data.
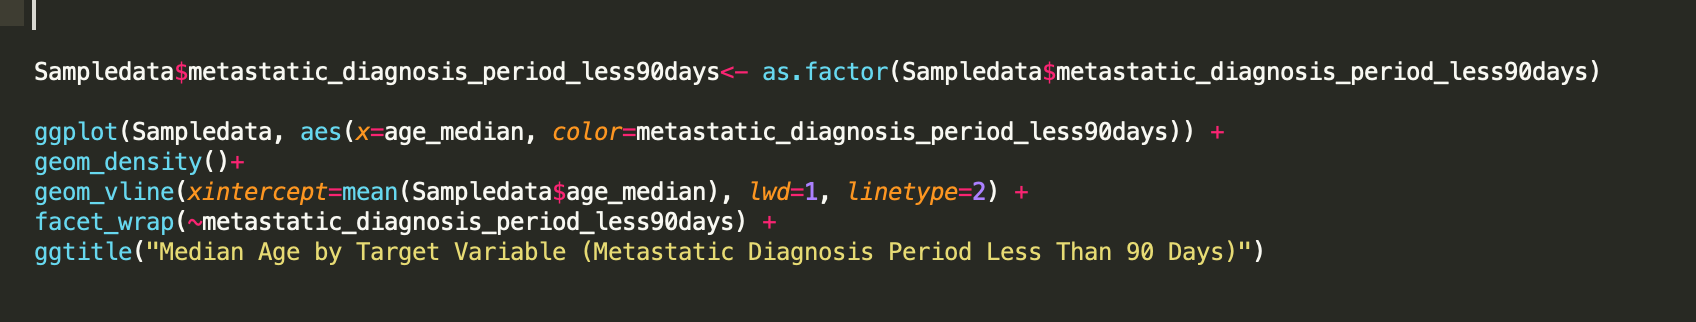
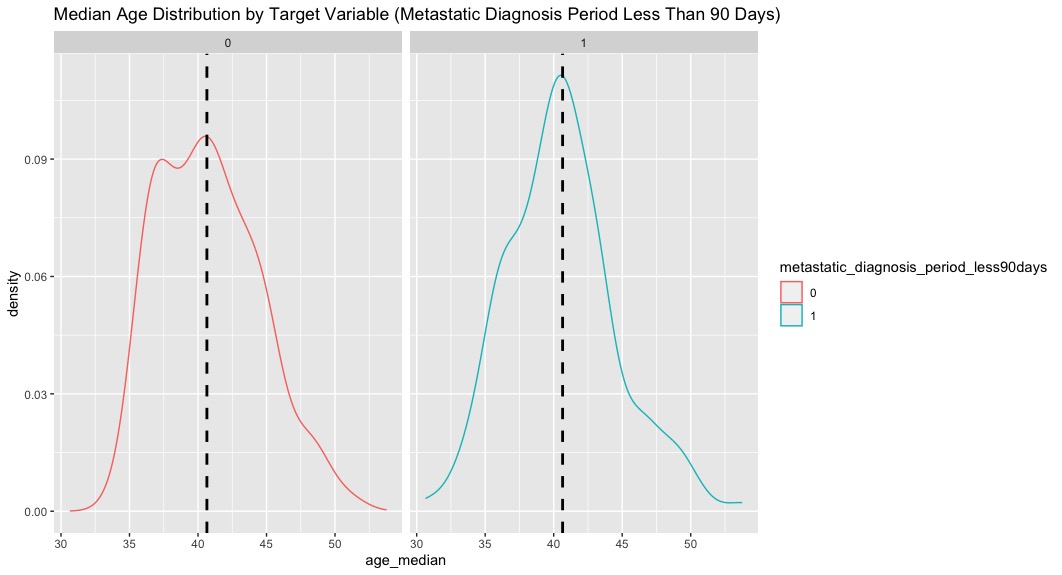
The kernel density plot is a great visualization of univariate distributions, especially when paired with the outcome. I used ggplot (as shown above) to compute and visualize the distribution (below.)
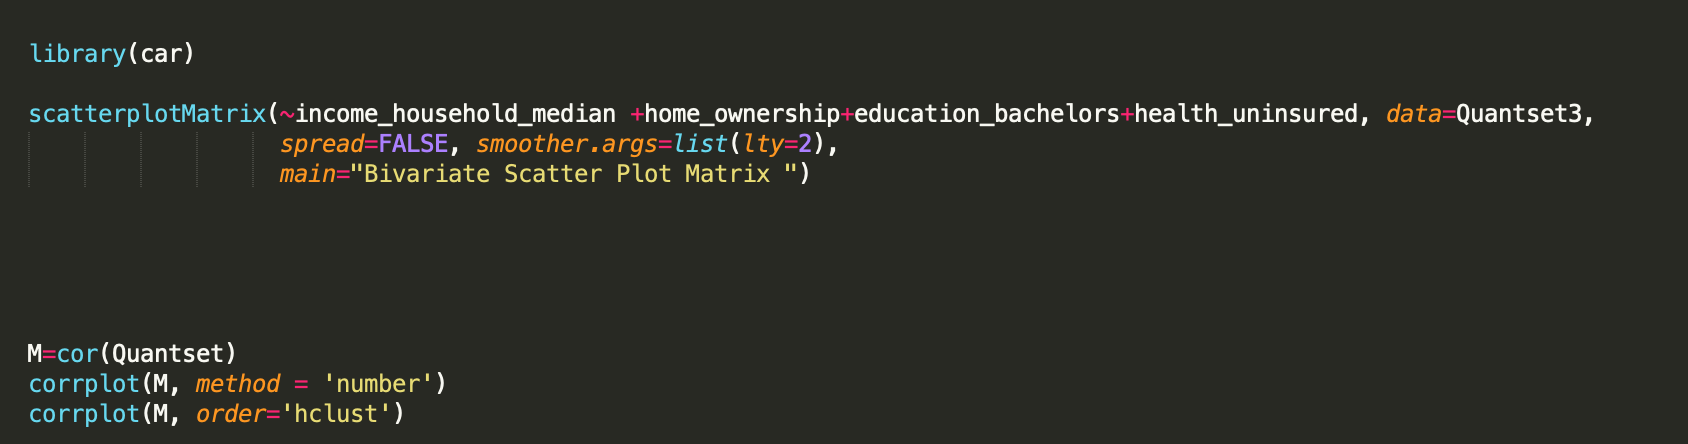
Once you examine the univariate distributions, you might want to examine how variables move together as well as any clusters that might emerge from the data. In the example below, I use the scatterplotMatrix function from “car” package to compute and visualize bivariate relationships for a subset of variables. I also use corrplot from “corrplot” to compute the correlation and visualize it.
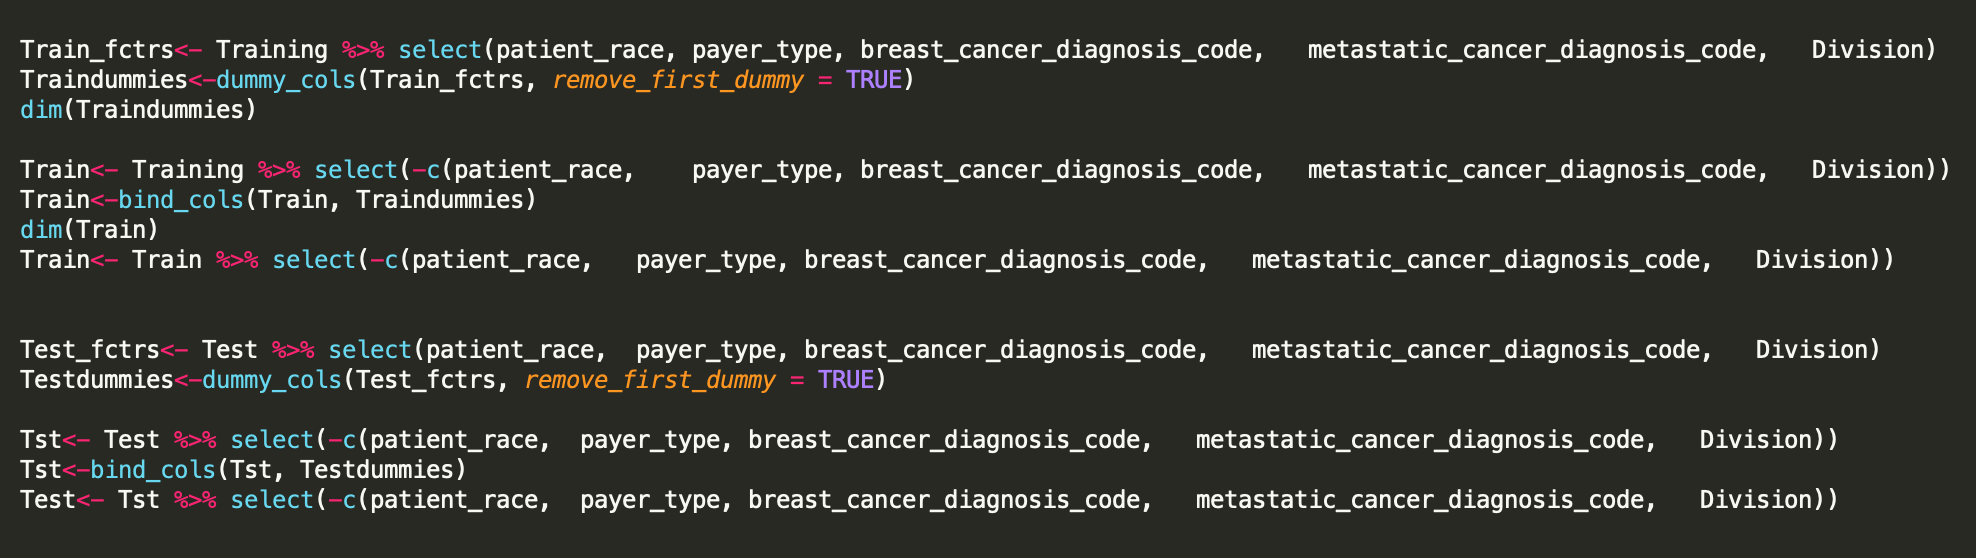
Now that you have built an intuition on the relationship between the variables, we can now proceed to actually modeling the drivers of an outcome. One of the first things you might want to do is select categorical variables to compute dummies. I recommend the dummy_cols function from the package “fastDummies” as shown below.
One thing to be careful about is once you have computed dummies, make sure to remove the original columns from the prepared dataset! Finally, you can bind the dummies and quantitative variables to create the datasets (as shown below).
Once you have prepared the Train and Test sets, you might want to compare the dimensions of both sets. This is particularly important for setting up a matrix for packages like XGBoost – which need both sets to have the same size. I find the “compare_df_cols” from the package “janitor” to be particularly useful for this purpose (as shown below).
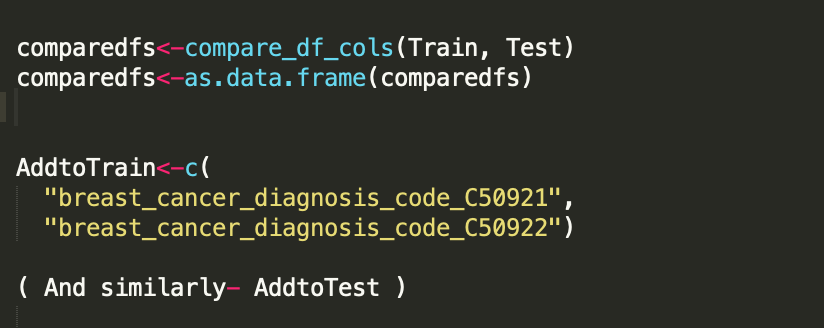
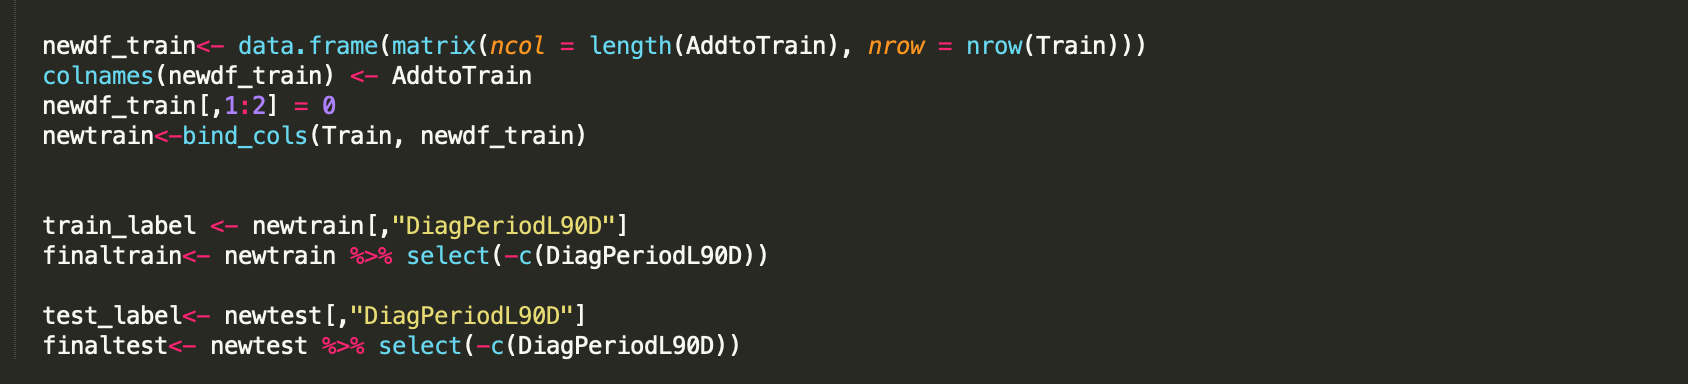
If you have misaligned train/ test sets, you can add to them and ensure they have the same dimension (as shown above). In this manner, you can create a final train/test set (as shown below).
Once you are with the final train/ test datasets, you can create a DMatrix as shown below.

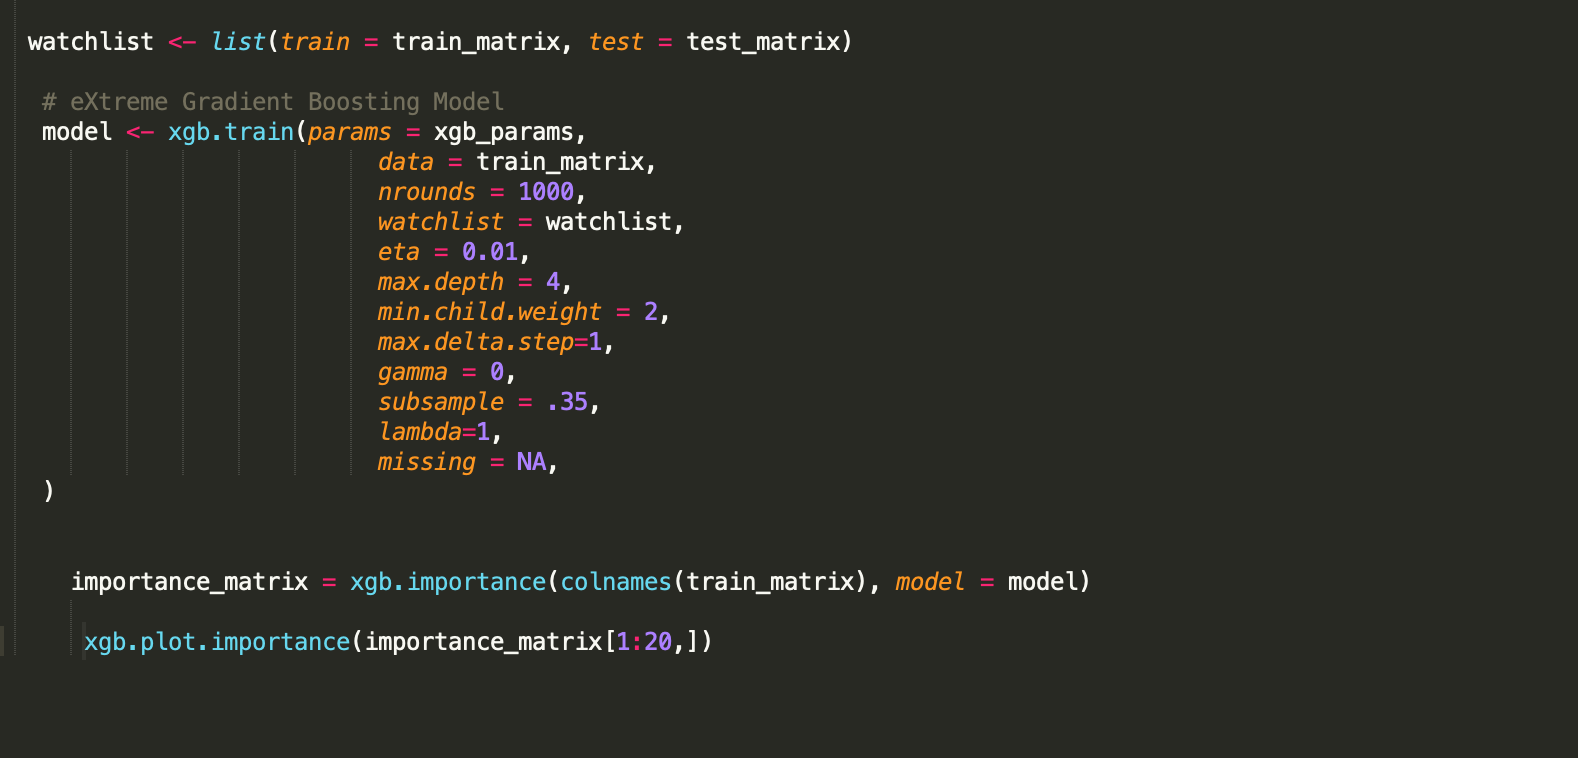
Once you have the DMatrices prepared, you can finally set up a model (ie: an XGBoost Model) as shown below. After you have run the model, you can compute and plot the importance matrix (as shown below).
In this tutorial we walked through the basic steps of EDA and modeling setup. Now you are ready to have fun! Try to change the parameters and see how they affect the outcome. Try to create new variables (derived, or new features) that might affect the outcome. Try other modeling approaches that you find interesting. The doors of exploration are wide open!
Join us for the WiDS Datathon 2024 competitions. Enjoy the WiDS Datathon!
Sharada Kalanidhi is Director of Data Science at Stanford Genome Technology Center, Stanford University School of Medicine.