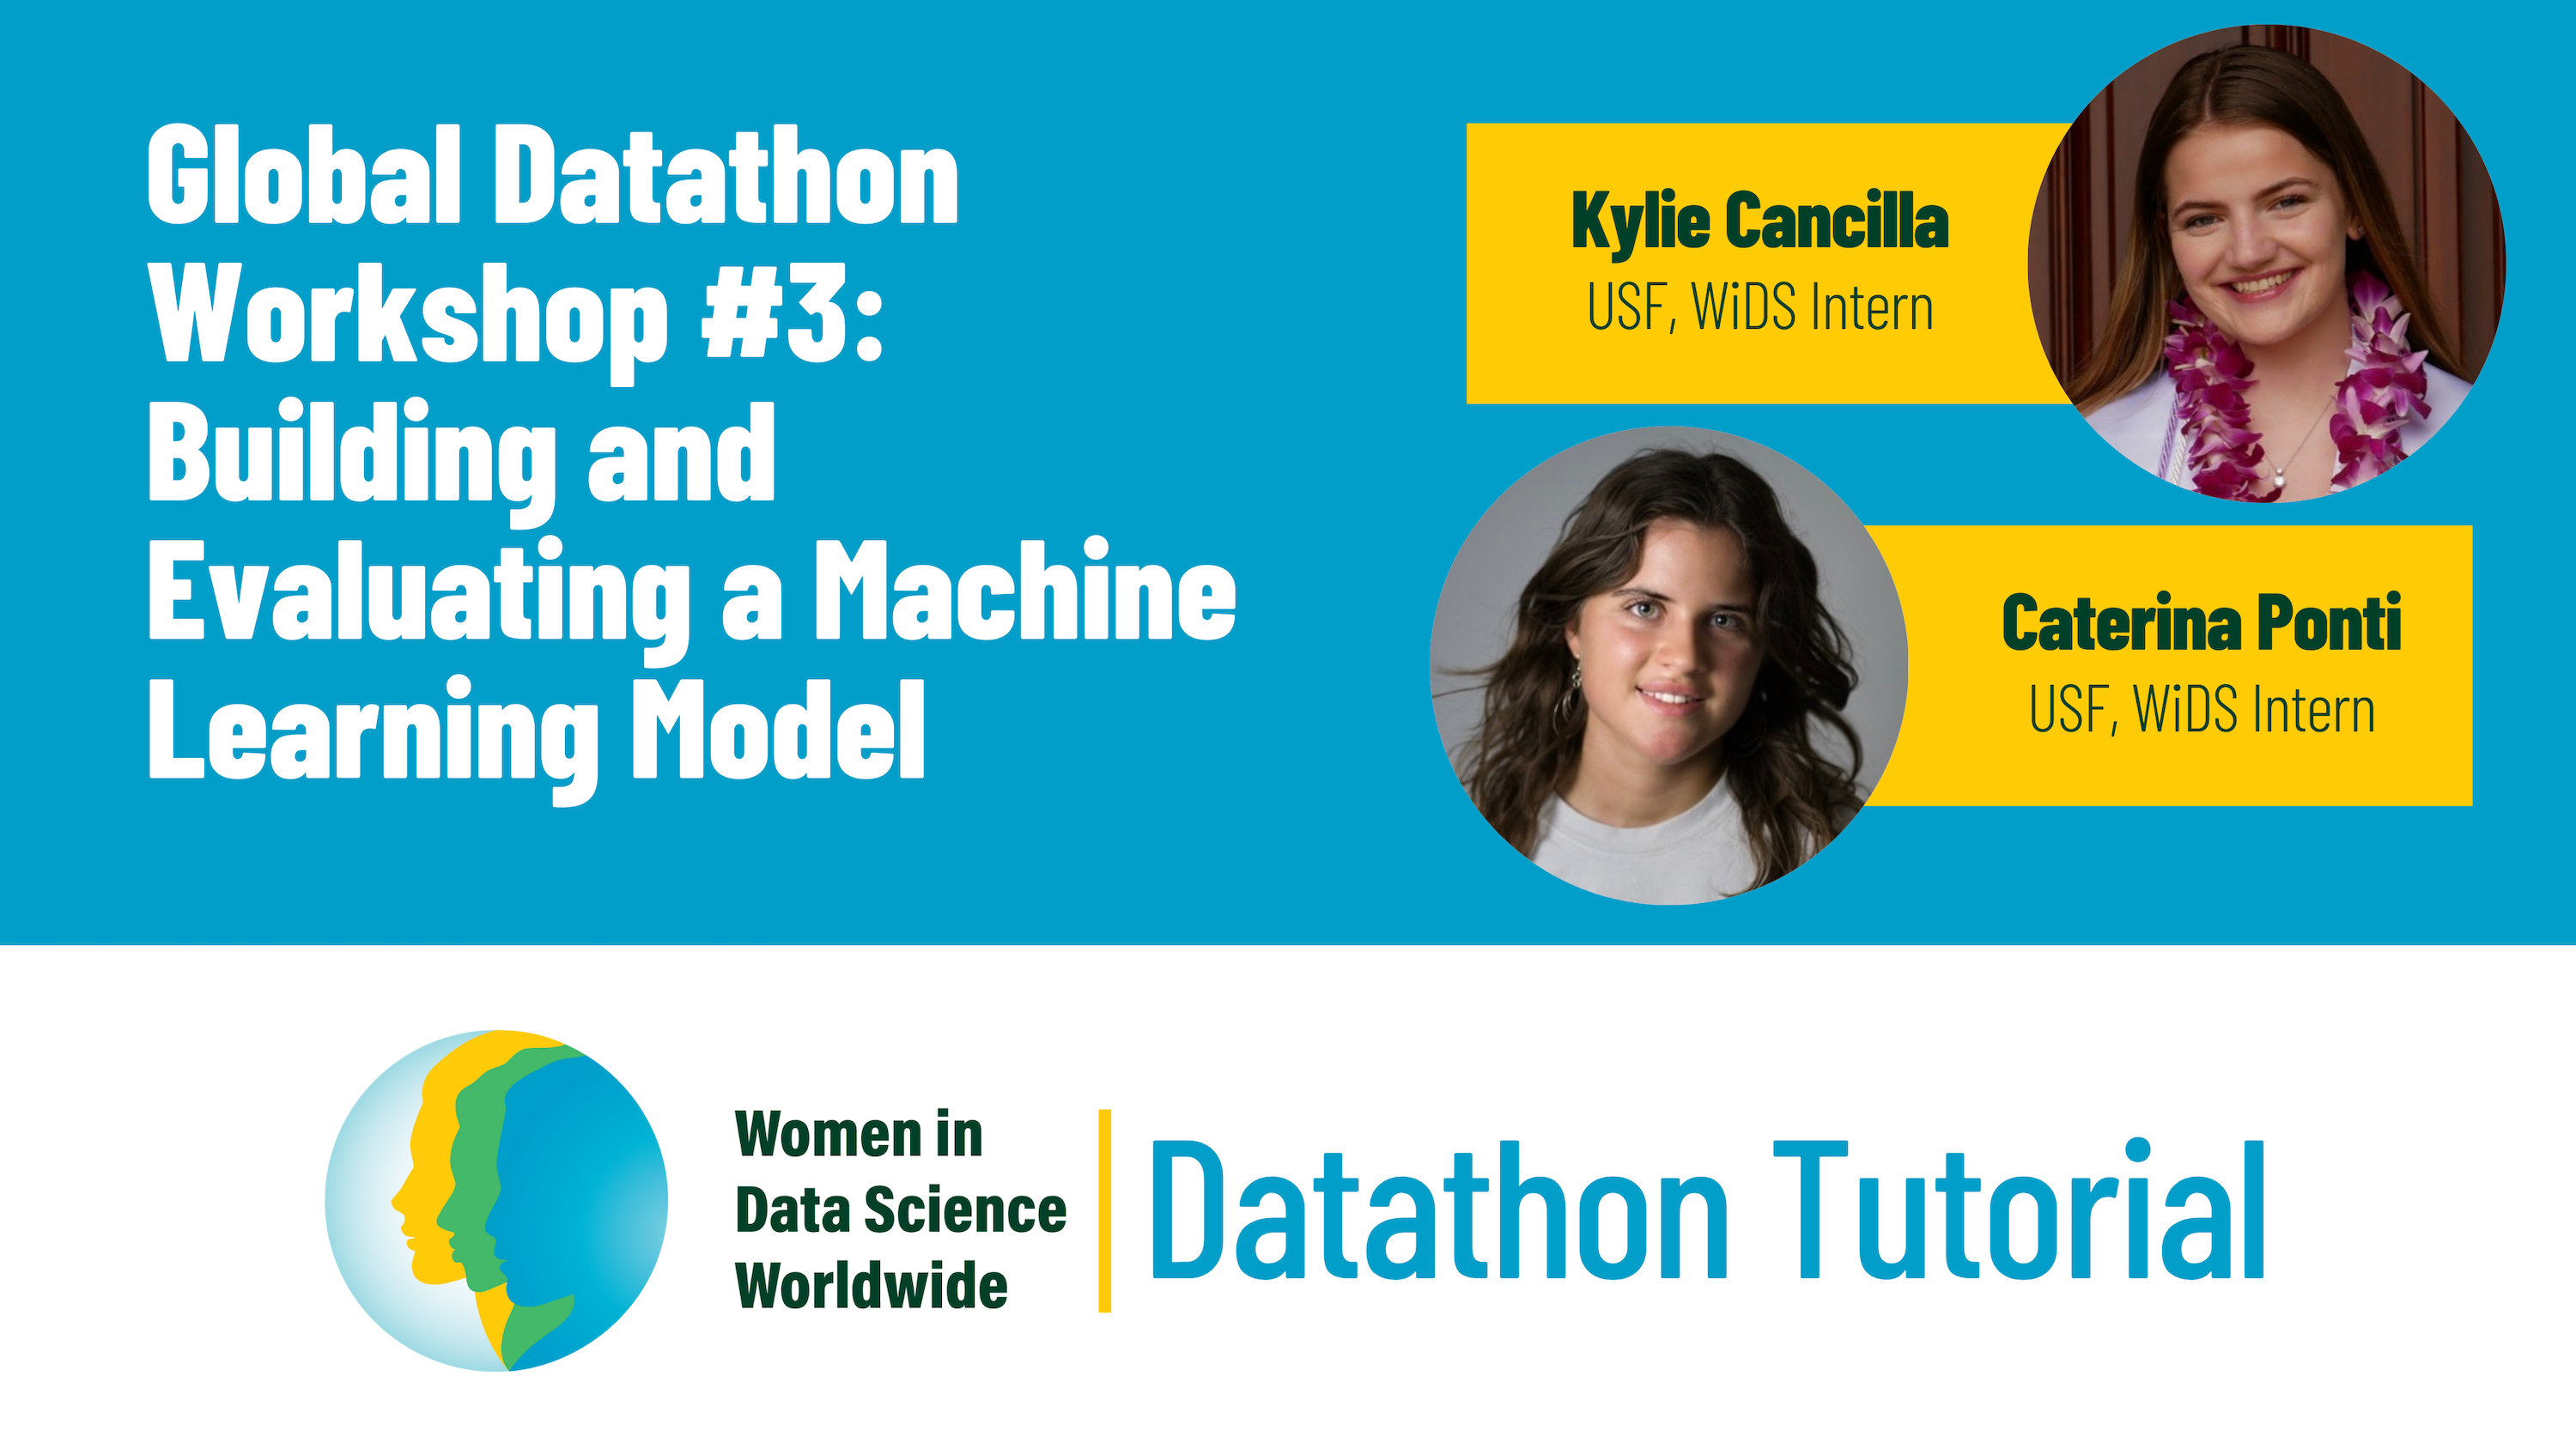
This workshop covers dataset preprocessing, encoding categorical variables, handling NaN values, and preparing data for machine learning in Python. Instructors will also go over F1 score, which is the metric used to evaluate participants.
This workshop covers dataset preprocessing, encoding categorical variables, handling NaN values, and preparing data for machine learning in Python. Instructors will also go over F1 score, which is the metric used to evaluate participants.
Datathon tutorial, dataset preprocessing, encoding categorical variables, handling NaN values, preparing data for machine learning in Python.
Hye Min Cho is a Data Scientist at Refik Anadol Studio, a Los Angeles-based practice that produces enthralling and immersive media art intended for anyone, any age and any background.
Top High School Team: Zeyneb Kaya Winners share their results from the WiDS Datathon 2023 challenge. Learn more
What key principles of design and data viz do you need to know to create effective and clear graphs? This talk will cover preattentive attributes, Gestalt principles, and principles of color use. It will provide the key concepts from design and data viz research that you need to know to communicate data effectively. The talk will include examples to demonstrate applying the concepts and comparing data viz effectiveness.
This workshop was conducted by Jenn Schilling, Founder of Schilling Data Studio.
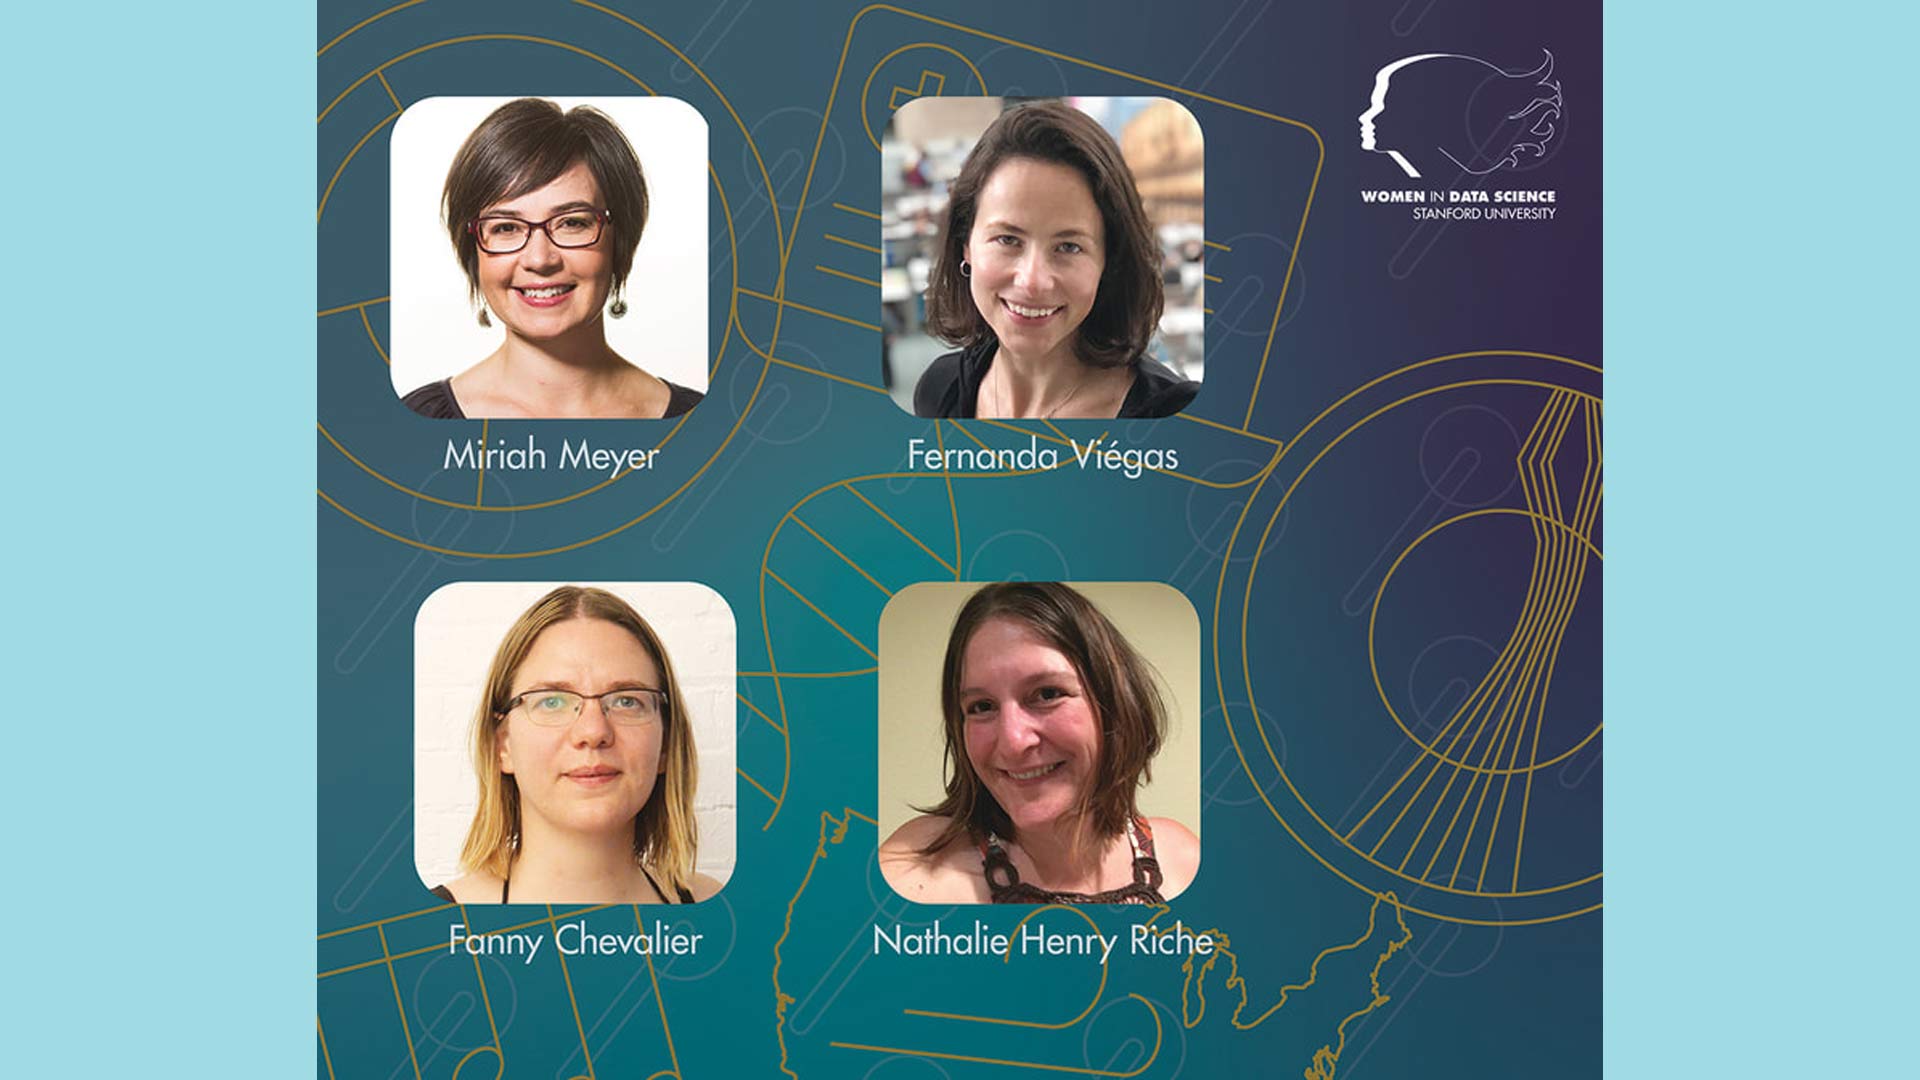
With the massive amounts of data that are generated and collected today, data visualization is an invaluable tool to help people explore and understand what it all means. Data visualizations can be exploratory to help analyze the data and explanatory to present insights to a broader audience. Both art and science, data visualization turns information into images and helps people see patterns, trends, and outliers in large data sets. Here is a sampling of recent WiDS talks and workshops that delve into different aspects of data visualization.
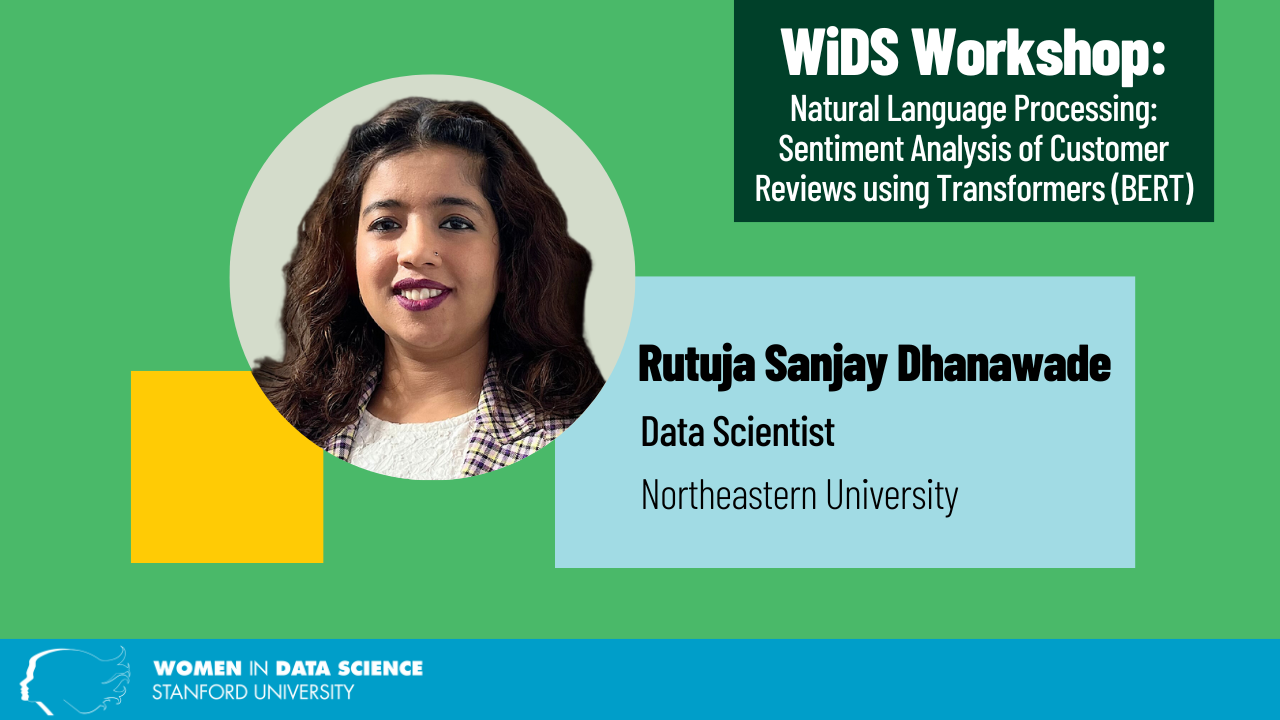
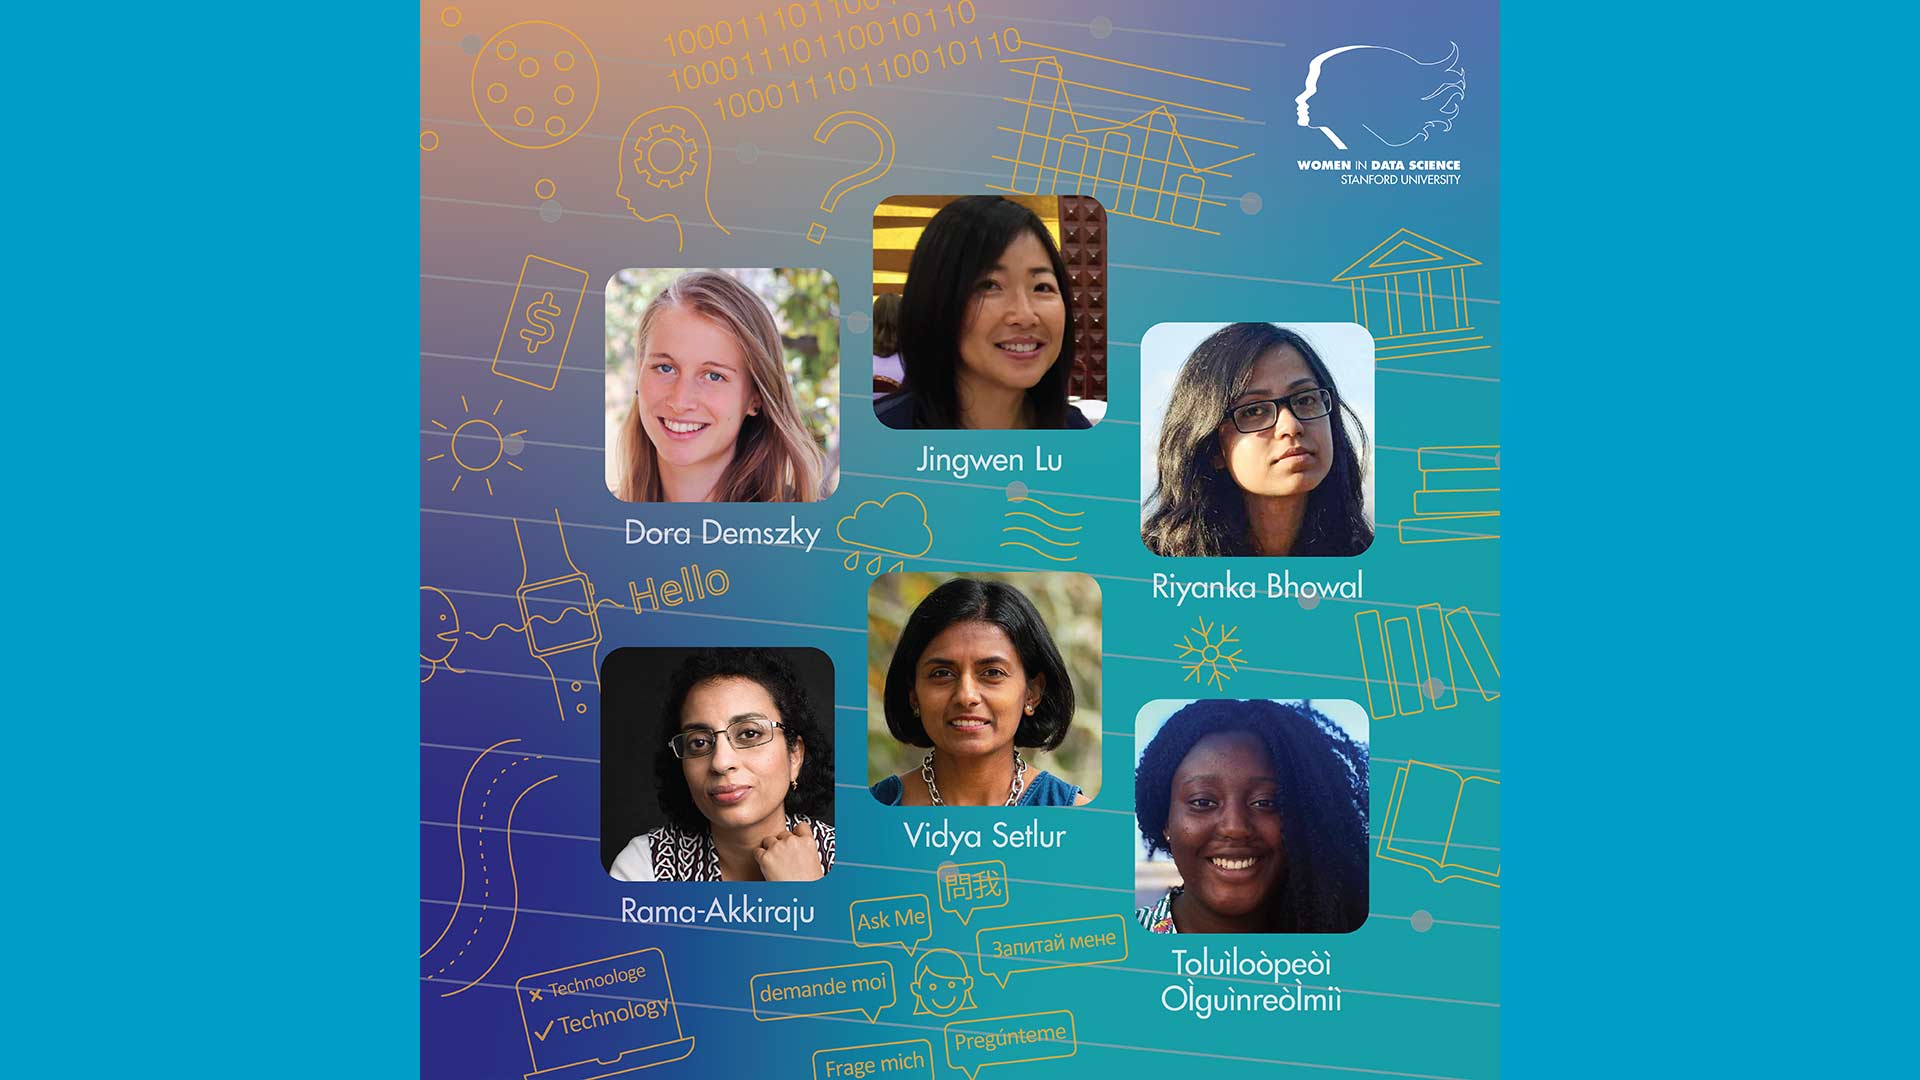
Whether it’s asking Siri about the weather, Google for directions, or a customer service bot about your bank account, Natural Language Processing (NLP) is an expected capability across applications today. In WiDS Conference keynotes, workshops and technical talks, experts explore various uses for NLP and how it is shaping how people interact with computers.
Data scientists work with large data sets that require computational analysis to gain insights and knowledge that often drive important decisions within organizations in industry, academia, non-profits, and government. In order for these insights to have the desired impact, data scientists need to communicate clearly to be well–and quickly–understood. Data visualization allows data scientists the ability to provide unique views into the data and about the data, turning data sets into insights at-a-glance.
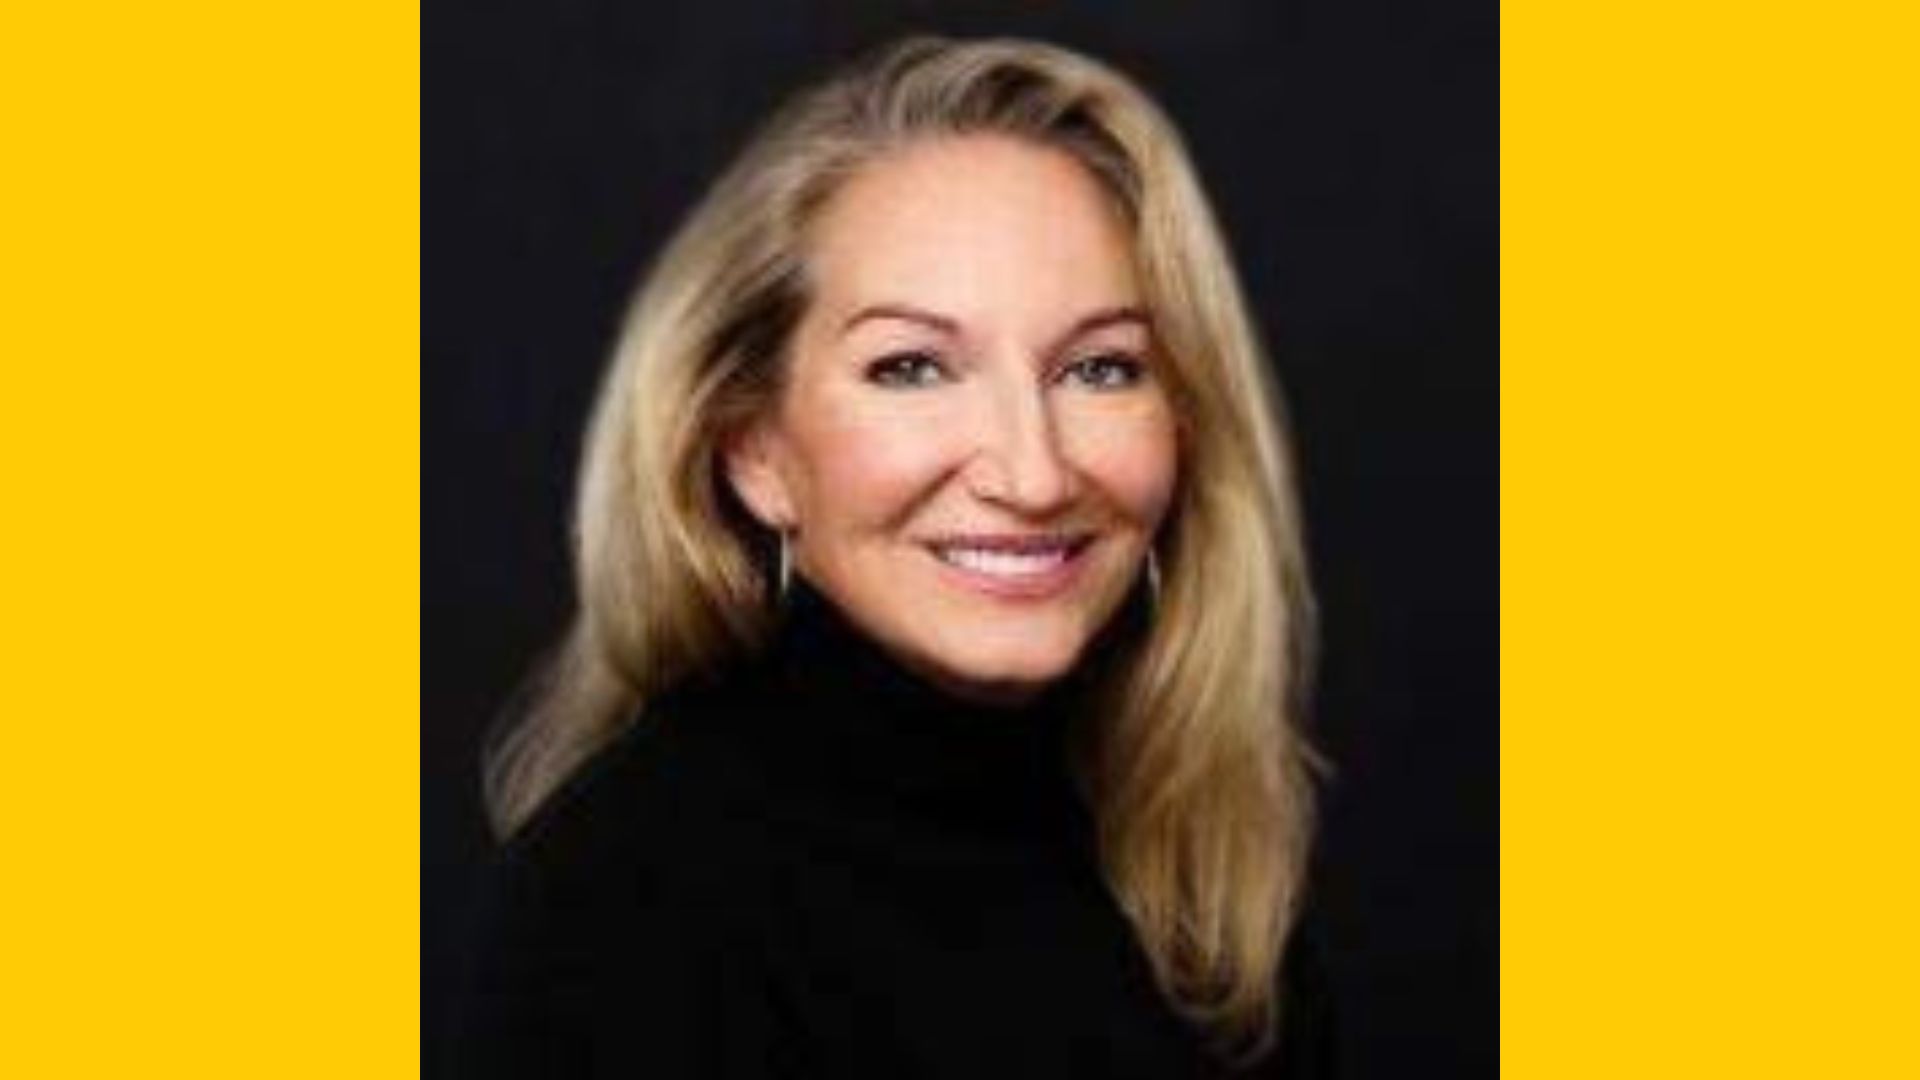
Suzanne Valentine, Facebook’s Director of Data Science for Global Marketing Solutions, has built her career turning data into business insights. Inspired by WiDS’ support for women data scientists, Facebook has become a sponsor, providing micro-scholarships for WiDS ambassadors.
Best of WiDS features Ema Rie on her talk ‘The Fusion of Science and Fashion’ from WiDS Tokyo @ Yokohama City University, 2020!
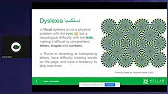
Best of WiDS features Areej Al-Wabil on her talk ‘Brain Art: Brain Computer Interfaces for AI Driven Artistic Expression’ from WiDS Riyadh 2020!
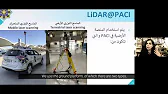
Best of WiDS features Bedoor Adel Alsadoun on her talk ‘3D Data using Laser Technology’ from Kuwait City 2020!