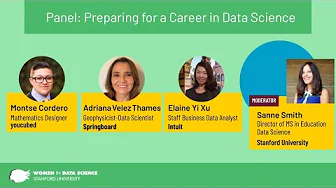
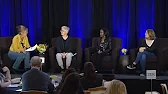
Panel: Preparing for a career in data science
Moderator:
Sanne Smith, Director of Master’s Program, Education Data Science, Stanford University, is the director of the master‚Äôs program Education Data Science and a lecturer at the Stanford Graduate School of Education. She teaches courses that introduce students to coding, data wrangling and visualization, various statistical methods, and the interpretation of quantitative research. She studies social networks and thriving, diverse contexts.
Panelists:
Montse Cordero, Mathematics Designer, youcubed, is a mathematics designer for youcubed, a center at Stanford University that aims to inspire, educate and empower teachers of mathematics, transforming the latest research on maths learning into accessible and practical forms. He is a co-author and professional development provider for youcubed’s Explorations in Data Science high school curriculum and has participated in multiple national summits for the advancement of data science in K-12 education (Data Science 4 Everyone Coalition, National Academies of Sciences Engineering and Medicine). Montse is also a mathematician interested in work at the intersection of combinatorics, algebra, and geometry. In all facets of their work, Montse endeavors to change the ways our culture thinks and talks about mathematics.
Adriana Velez Thames, Geophysicist-Data Scientist, Springboard Alumni. Adriana recently completed a transition to Data Science after many years in the Oil and Gas industry as a Senior Geophysicist. Her primary focus was in seismic data processing for imaging the Earth’s subsurface to guide energy exploration projects. From 2012-2019, she worked at TGS where her responsibilities included QC of deliverables, testing of internal software updates, and conducting test projects and benchmarks. This involved extensive analysis and manipulation of terabyte-sized digital subsurface data using sophisticated algorithms. She believes that data-driven decisions are the best way to solve problems in any industry. Having been born in Colombia and attained post-graduate degrees in Russia, she is fluent in English, Spanish, and has working proficiency in Russian. Currently she continues educational studies in data science and spatial data science.
Elaine Yi Xu, Staff Business Data Analyst, Intuit, is a passionate data analytics and data science practitioner, putting her undergrad degree in Statistics and MS in Info Sys and DS into everyday business decision-making. She’s been working in-house in web analytics, product analytics, and marketing analytics for multiple industries, including retail (lululemon), automotive (Kelley Blue Book), and most recently at Intuit, the global technology platform. She specializes in the measurement of Go-To-Market marketing strategies, assessment of marketing campaign effectiveness, optimization of user experience, and A/B Testing. She thrives to be the connective tissue between business, analytics, engineering, and data science, combining all facets of science to help arrive at the most optimal business decisions.
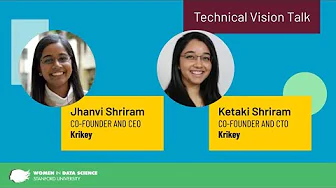
Jhanvi Shriram, Co-Founder and CEO, Krikey alongside Ketaki Shriram
Co-Founder and CTO, Krikey present Technical Vision Talk “Bringing Motion Diffusion Models to Immersive Entertainment”. Most generative models thus far have focused on utilizing LLMs for consumer products. The introduction of motion diffusion models to this space provides a novel avenue to engage consumers, especially in the field of entertainment. This talk will cover a text-to-animation motion diffusion model. This model generates animations in less than 5 minutes. These animations can be applied to any 3D file and utilized with any 3D software. Practical applications include optimizing production pipelines for gaming, film, and immersive learning. We will also cover the implications for these industries as they adopt new generative tools in production workflows. To learn more about our tool and try it for yourself, please visit krikey.ai.
Jhanvi Biography:
Jhanvi is currently the CEO of Krikey, an AI gaming tools service that she co-founded with her sister. Krikey recently closed their Series A round, led by Reliance Jio, India’s biggest telecom operator. Prior to Krikey, Jhanvi worked at YouTube as a Production Strategist on operations and creator community programs, which sparked her interest in working with content creators. She also worked at JauntVR and Participant Media. In 2014, Jhanvi and her sister, Ketaki Shriram, co-produced a feature film titled, ‚ÄúTrue Son,‚Äù which followed a 22-year old‚Äôs political campaign in Stockton, CA. The film premiered at the 2014 Tribeca Film Festival and was acquired by FusionTV/Univision. Jhanvi holds a BA (Political Science and African Studies) and MBA from Stanford University, and a MFA (Producing) from USC. You can learn more here: krikey.ai.
Ketaki Shriram Biography:
Dr. Shriram is a scientist, film producer, and wildlife photographer interested in the impact of immersive worlds on human behavior. She is currently the Chief Technology Officer at Krikey, an AI gaming tools service that she co-founded with her sister. Krikey recently closed their Series A round, led by Reliance Jio, India’s biggest telecom operator. Dr. Shriram received her BA, MA, and PhD at the Stanford Virtual Human Interaction Lab. She previously worked at Google [x] and at Meta‚Äôs Reality Labs. Dr. Shriram was selected for the Forbes 30 Under 30 2020 Class in the Gaming category. You can learn more here: krikey.ai.
—
Julia Stewart Lowndes, Director, Openscapes presents Technical Vision Talk “Openscapes: Supporting Kinder Science for Future Us”. At Openscapes, we believe open science can accelerate interoperable, data-driven solutions and increase diversity, equity, inclusion, and belonging in research and beyond. Our main activity is mentoring environmental and Earth science teams in open science, and connecting and elevating these researchers both through tech like R, Python, Quarto, and JupyterHubs and communities like RLadies, Black Women in Ecology Evolution, and Marine Science, Ladies of Landsat, and NASA. We will share stories and approaches about open science as a daily practice ‚Äì better science for future us ‚Äì and welcome you to join the movement.
Biography:
Julia Stewart Lowndes, PhD, is a marine ecologist working at the intersection of actionable environmental science, data science, and open science. Julia’s main focus is mentoring teams to develop technical and leadership mindsets and skills for data-intensive research, grounded in climate solutions, inclusion, and kindness. She founded Openscapes in 2018 as a Mozilla Fellow and Senior Fellow at the National Center for Ecological Analysis and Synthesis (NCEAS) at the University of California Santa Barbara (UCSB), having earned her PhD from Stanford University in 2012 studying drivers and impacts of Humboldt squid in a changing climate.
—
What key principles of design and data viz do you need to know to create effective and clear graphs? This talk will cover preattentive attributes, Gestalt principles, and principles of color use. It will provide the key concepts from design and data viz research that you need to know to communicate data effectively. The talk will include examples to demonstrate applying the concepts and comparing data viz effectiveness.
This workshop was conducted by Jenn Schilling, Founder of Schilling Data Studio.
This workshop is targeted toward those who are new to coding. This presentation will teach an individual how to analyze their personal Spotify data, create visualizations and prepare their data to be used in business processes. This demonstration will use Python so a new coder will understand foundational coding syntax that can be used in other languages.
This workshop was conducted by Nicole Crosdale, a Graduate student at the University of Florida.
Resources and slides for this workshop: https://bit.ly/spotify_resources
You’ve heard it before – Python vs MATLAB vs R but in reality, programming languages are often used together! In this hands-on workshop, you’ll learn how to use MATLAB and Python together with practical examples. Specifically, you’ll learn how to: – Call Python libraries from MATLAB – Call user-defined Python commands, scripts, and modules – Manage and convert data between languages – Package MATLAB algorithms to be called from Python
This workshop was conducted by Heather Gorr, Senior Product Marketing Manager, MATLAB and Grace Woolson, Student Competitions Technical Evangelist – Data Science at Mathworks.
Resources and slides for this workshop: https://bit.ly/matlab_python_slides
Learn how you can apply AI in your field without extensive knowledge in programming. This hands-on session includes a quick recap on the fundamentals of AI and two exercises where you will learn how to classify human activities using MATLAB® interactive tools and apps:
– Accessing and preprocessing data acquired from a mobile device
– Classifying the labeled data using two apps: The Classification Learner app and the Deep Network Designer app
At the end of the workshop, you will be able to design and train different machine learning and deep learning models without extensive programming knowledge. In addition, you will also learn how to automatically generate code from the interactive workflow. This will not only help you to reuse the models without manually going through all the steps but also to learn programming or advance your coding skills.
This workshop was conducted by Gaby Arellano Bello and Neha Sardesai, Senior Application Engineers in Education at Mathworks.
Access resources for this workshop: https://bit.ly/low_code_ai_resources
Responsible AI is reaching new heights these days. Companies have started exploring Explainable AI as a means to explain the results better to senior leadership and increase their trust in AI Algorithms. This workshop will entail an overview of this area, importance of it in today’s era, and some of the practical techniques that you can use to implement it. As a bonus, it will also cover some industry use cases and limitations of these techniques. Join me in unboxing this black box!
This workshop was conducted by Supreet Kaur, Assistant Vice President at Morgan Stanley.
Slides for this workshop: https://bit.ly/explainableai_slides

During the workshop, we show a simple exploratory data analysis using Deepnote. We will focus on personal data from Camino de Santiago pilgrimage which we retrieved from our Strava API and show you how to get it from your own device. Using this data we explain a theory about Exploratory Data Analysis and show some use cases.
This workshop was conducted by Tereza Vaňková and Alleanna Clark of Deepnote.
Resources used in this workshop:
– https://bit.ly/deepnote_notebook
– https://bit.ly/deepnote_slides

This year’s WiDS Datathon Excellence in Research Award (Phase II) broadened participants' focus to examine the impact of climate change. Participants were able to explore a domain related to their...
Read More
Best practices in data visualization and dashboard design are numerous and sometimes contradictory, but a straightforward method to apply design thinking to creating dashboards is effective and universally applicable. This session will cover the details of design thinking and how it can be applied to dashboard development to create impactful dashboards that meet user needs and provide valuable insights.
This workshop was conducted by Jenn Schilling, Senior Research Analyst at the University of Arizona.
Exploring Hidden Markov Models | Julia Christina Costacurta
Hidden Markov Models (HMMs) are used to describe and analyze sequential data in a wide range of fields, including handwriting recognition, protein folding, and computational finance. In this workshop, we will cover the basics of how HMMs are defined, why we might want to use one, and how to implement an HMM in Python. This workshop might be of particular interest to attendees from May 25’s “Intro to Markov Chains and Bayesian Inference” session. Introductory background in probability, statistics, and linear algebra is assumed.
This workshop was conducted by Julia Christina Costacurta, PhD Candidate at Stanford University
Useful resources for this workshop:
– https://bit.ly/hmm_presentation
– https://bit.ly/hmm_tutorial_notebook
Make answering ‘what if’ analysis questions a whole lot easier by learning about state-of-the-art, end-to-end applied frameworks for causal inference.
We will cover:
Microsoft’s “Do Why” Package Causal Impact in Python – DoWhy | An end-to-end library for causal inference — DoWhy | An end-to-end library for causal inference documentation (microsoft.github.io)
Bayesian Causal Impact in R
MLE Causal Impact in Python
Bonus: AA Testing, when to use and why it matters
We will apply these models in the context of understanding the impact of a marketing rewards campaign, as well as understand the impact from a product/feature upgrade
This workshop was conducted by Jennifer Vlasiu, Data Science & Big Data Instructor at York University
Useful resources for this workshop:
– https://bit.ly/github_casual_impact
Image classification is a task in the Computer Vision domain that takes in an image as input and outputs a label for that image. Deep learning is the most effective modern method for modeling this task. In this interactive workshop, we will walkthrough a Jupyter Notebook which will overview how to perform multi-class image classification in Python using the PyTorch library. The intention is to give the audience a broad overview of this task of classification and inspire participants to explore the vast fields of visual recognition and computer vision at large.
This workshop was conducted by Cindy Gonzales, Data Science Team Lead for the Biosecurity and Data Science Applications Group at Lawrence Livermore National Laboratory
Useful resources for this workshop:
– https://bit.ly/deep_learning_files
– https://bit.ly/deep_learning_notebook
As data scientists, the ability to understand our models’ decisions is important, especially for models that could have a high impact on people’s lives. This may pose several challenges, as most models used in the industry are not inherently explainable. Today, the most popular explainability methods are SHAP (SHapley Additive exPlanations) and LIME (Local Interpretable Model-Agnostic Explanation). Each method offers convenient APIs, backed by solid mathematical foundations, but falls short in intuitiveness and actionability.
In this workshop/article, I will introduce a relatively new model explanation method – Counterfactual Explanations (CFs). CFs are explanations based on minimal changes to a model’s input features that lead the model to output a different (mostly opposite) predicted class. CFs have been shown to be more intuitive for humans to comprehend and provide actionable feedback, compared to traditionalSHAP and LIME methods. I will review the challenges in this novel field (such as how to ensure that the CF proposes changes which are feasible), provide a birds-eye view of the latest research and give my perspective, based on my research in collaboration with Tel Aviv University, on the various aspects in which CFs can transform the way data science practitioners understand their ML models.
This workshop was conducted by Aviv Ben Arie, Data Science Manager at Intuit
Research proves that the human brain processes visualizations better than text. And data visualizations prove that further.
Data visualization is the last phase in the data life cycle. It is the art and science of making data easy to understand and consume for the end user. Data visualizations present clusters of data in an easy-to-understand layout and that’s the reason it becomes mandatory for large amounts of complex data. Ideal data visualization shows the right amount of data, in the right order, in the right visual form, to convey the high priority information to the right audience and for the right purpose. If the data is presented in too much detail, then the consumer of that data might lose interest and the insight.
There are innumerable types of visual graphing techniques available for visualizing data. The right visualization arises from an understanding of the totality of the situation in context of the business domain’s functioning, consumers’ needs, nature of data, and the appropriate tools and techniques to present data. Ideal data visualization should tell a true, complete and simple story backed by data effectively, while keeping it insightful and engaging.
This workshop was conducted by Pariza Kamboj, Professor at Sarvajanik College of Engineering & Technology (SCET).
Useful resources for this workshop:
– Workshop #1: https://youtu.be/lRBuknaPRNI
– Jupyter code: https://bit.ly/jupyter_notebook2
– https://bit.ly/cars3_data
– https://bit.ly/execution_google_colab
– https://bit.ly/anaconda_installation_…

A propensity model attempts to estimate the propensity (probability) of a behavior (e.g., conversion, churn, purchase, etc.) happening during a well-defined time period into the future based on historical data. It is a widely used technique by organizations or marketing teams for providing targeted messages, products or services to customers. This workshop shares an open-sourced package developed by Google, for building an end-to-end Propensity Modeling solution using datasets like GA360, Firebase or CRM and using the propensity predictions to design, activate and measure the impact of a media campaign. The package has enabled companies from e-commerce, retail, gaming, CPG and other industries to make accelerated data-driven marketing decisions.
This workshop was conducted by Lingling Xu, Bingjie Xu, Shalini Pochineni and Xi Li, data scientists on the Google APAC team.
Useful resources for this workshop:
– Workshop #1: https://youtu.be/rQhQca8RCuM
– https://bit.ly/propensity_modeling_pa…
– https://bit.ly/bigquery_export_schema
– https://bit.ly/ga_sample_dataset
– https://bit.ly/ml_windowing_pipeline
Neural networks have been widely celebrated for their power to solve difficult problems across a number of domains. We explore an approach for leveraging this technology within a statistical model of customer choice. Conjoint-based choice models are used to support many high-value decisions at GM. In particular, we test whether using a neural network to model customer utility enables us to better capture non-compensatory behavior (i.e., decision rules where customers only consider products that meet acceptable criteria) in the context of conjoint tasks. We find the neural network can improve hold-out conjoint prediction accuracy for synthetic respondents exhibiting non-compensatory behavior only when trained on very large conjoint data sets. Given the limited amount of training data (conjoint responses) available in practice, a mixed logit choice model with a traditional linear utility function outperforms the choice model with the embedded neural network.
This workshop was conducted by Kathryn Schumacher, Staff Researcher in the Advanced Analytics Center of Expertise within General Motor’s Chief Data and Analytics Office.
The workshop would focus on the basic to intermediate levels of SQL. We will start with querying a database, using filters to clean the data. Joining different tables. Aggregate functions and use of ‘CASE WHEN’ for better query performances. Subqueries and Common Table Expressions (CTEs) and a comparison between them. Use of window functions. Lead and lag functions and the scenarios when they can be used. Pivot tables and when not to use them!
This workshop was conducted by Sreelaxmi Chakkadath, Data Science Master’s student at Indiana University Bloomington.
Useful resources for this workshop:
– PostgreSQL install link: https://www.postgresql.org/
– https://bit.ly/sql_workshop_script
– https://bit.ly/sql_workshop_codes
– https://bit.ly/sql_ppt_slides
In the current era, Data Science is rapidly evolving and proving very decisive in ERP (Enterprise Resource Planning). The dataset required for building the analytical model using data science, is collected from various sources such as Government, Academic, Web Scraping, API’s, Databases, Files, Sensors and many more. We cannot use such real-world data for analysis process directly because it is often inconsistent, incomplete, and more likely to contain bulk errors. We often hear the phrase “garbage in, garbage out”. Dirty data or messy data riddled with inaccuracies and errors, result in a bad/improperly trained model which in turn might result in poor business decisions and sometimes even hazardous to the domain. Any powerful algorithm is failed in providing correct analysis when applied to bad data. Therefore, data must be curated, cleaned and refined to be used in data science and products based on data science. To perform these tasks, “Data Preparation” is required which includes two methods that are: Data Pre-processing, and Data Wrangling. Most data scientists spend the majority of their time in data preparation.
This workshop was conducted by Pariza Kamboj, Professor at Sarvajanik College of Engineering & Technology (SCET).
Useful resources for this workshop:
– https://bit.ly/jupyter_code
– https://bit.ly/cars3_dataset
– https://bit.ly/execution_google_colab
– https://bit.ly/anaconda_installation_…
How can we make sense of the unseen world? Using AI, sensors & IoT for scene exploration | Mathworks
Have you wondered about being able to detect buried objects? Do you think your mobile device can be used to detect these buried objects? Metal is all around us and is often not seen but buried. The detection of metal is in many places on Earth. In fact the detection of metal is connected to a variety of applications such as: to provide insight regarding land use, detection of historic artifacts, determine the presence of various devices, and more.
In our workshop, we will explore using your own mobile device as a metal detector in your local environment. During this workshop we will provide an overview of the basics of sensors, AI, and IoT which will be required for building a prototype of our application. We’ll do hands-on exercises where you will acquire data from sensors, obtain summary statistics on the acquired data, and train a human activity classifier to understand what was done while data was being collected. We will also have an engaged discussion regarding topics to be mindful of with respect to this application such as considerations regarding the collection and usage of location data. You will leave motivated and ready to use sensors, AI, and IoT in your own projects via MATLAB!
Workshop presenters:
– Louvere Walker-Hannon, Application Engineering Senior Team Lead, MathWorks
– Loren Shure, Consulting Application Engineer, MathWorks
– Sarah Mohamed, Senior Software Engineer, MathWorks
– Shruti Karulkar, Quality Engineering Manager, MathWorks

Rukmini Iyer, Distinguished Engineer, Corporate Vice President at Microsoft, delivers the Closing Address at the WiDS Worldwide conference.
Rukmini runs Microsoft Advertising�s engineering organization, managing a multi-billion dollar marketplace globally.
Climate change is one of the critical challenges facing humanity today. Over the past few years, there have been widespread climate-driven disruptive events such as floods and wildfires. The devastation caused by these events has resulted in an awareness of the urgency of the issue. Indeed, people and governments have started working together in the direction of climate-focused coordinated action. At WiDS, we believe that it will be important for future data scientists to gain familiarity with mathematical and statistical models used to model climate data. For this reason, the focus of the WiDS Datathon this year is a climate-focused challenge: prediction of building energy consumption.

The 5th Annual Women in Data Science (WiDS) Datathon will launch in January, in advance of the WiDS Worldwide Conference to be held on March 7th, 2022. This year’s WiDS Datathon, organized...
Read More
Cognitive neuroscientists are often interested in broad research questions, yet use overly narrow experimental designs by considering only a small subset of possible experimental conditions. This limits the generalizability and reproducibility of many research findings. In this workshop, I present an alternative approach, “The AI Neuroscientist”, that resolves these problems by combining real-time brain imaging with a branch of machine learning, Bayesian optimization. Neuroadaptive Bayesian optimization is an active sampling approach that allows to intelligently search through large experiment spaces with the aim to optimize an unknown objective function. It thus provides a powerful strategy to efficiently explore many more experimental conditions than is currently possible with standard brain imaging methodology. Alongside methodological details on non-parametric Bayesian optimization using Gaussian process regression, I will present results from a clinical study where we applied the method to map cognitive dysfunction in stroke patients. Our results demonstrate that this technique is both feasible and robust also for clinical cohorts. Moreover, our study highlights the importance of moving beyond traditional ‘one-size-fits-all’ approaches where patients are treated as one group. Our approach can be combined with brain stimulation or other therapeutics, thereby opening new avenues for precision medicine targeting a diverse range of neurological and psychiatric conditions.
In this workshop, we focus on temporal domain from perspective of both traditional recommender systems and deep neural networks. We first start with the classic latent factor model. We introduce temporal dynamics in the latent factor model and show how this improves performance. We then move into sequential modelling using deep neural networks by presenting state-of-the-art in the field and discuss the advantages and disadvantages.
This workshop was conducted by Romy Lorenz, Postdoctoral Fellow at Stanford University and University of Cambridge
Data Science workflows typically entail using Machine Learning.
Machine Learning can provide insight into various datasets and can assist with automating various types of analysis.
In this workshop you will explore a process for getting started with implementing Machine Learning interactively to train a model to predict tsunami intensity and implement other relevant tasks.
This workshop was conducted by Louvere Walker-Hannon, and Heather Gorr from Mathworks.
Want to learn more about trends like AI, IoT and wearable tech? In one hour, we will cut through the hype by building a “smart” fitness tracker using your own mobile device. We’ll do hands-on exercises: you’ll acquire data from sensors, design a step counter and train a human activity classifier. You will leave motivated and ready to use machine learning and sensors in your own projects!
This workshop was conducted by Louvere Walker-Hannon, Shruti Karulkar, & Sarah Mohamed from MathWorks.
How can sharing stories help us as a community? How do we learn how to find a story from the events of someone else’s life or our own? How can this relate to our own tendency as data-scientists to connect the dots, to find meaning through patterns? Join us in this WiDS workshop on telling and sharing stories where we will address these questions and learn how our stories are important in shaping the community we want to see in Data Science.
This workshop was conducted by Izzy Aguiar, phD student at Stanford University, ICME.
In this workshop, you will learn about the core concepts of BML – how it is different from the frequentist approaches, building blocks of Bayesian inference and what known ML techniques look like in a bayesian set-up. You will also learn how to use various sampling techniques for bayesian inference and why we need such techniques in the first place. The workshop will also provide links and materials to continue your Bayesian journey afterwards.
This workshop is meant as an introduction to select BML modules – we strongly recommend you to continue exploring the world of bayesian once you have taken this first step.
This workshop was conducted by Ashwini Chandrashekharaiah & Debanjana Banerjee at Walmart Global Tech.
Recommender systems are playing a major role in e-commerce industry. They are keeping users engaged by recommending relevant content and have a significant role in driving digital revenue.
Following tremendous gains in computer vision and natural language processing with deep neural networks in the past decade, the recent years have seen a shift from traditional recommender systems to deep neural network architectures in research and industry.
In this workshop, we focus on temporal domain from perspective of both traditional recommender systems and deep neural networks. We first start with the classic latent factor model. We introduce temporal dynamics in the latent factor model and show how this improves performance. We then move into sequential modelling using deep neural networks by presenting state-of-the-art in the field and discuss the advantages and disadvantages.
This workshop was conducted by Aleksandra Cerekovic & Selene Xu at Walmart Gobal Tech.
Welcome to the world of artificial intelligence (AI) and augmented reality (AR)! This workshop explains AI and AR via hands on exercises where you will interact with your augmented world. You will learn about applications where the technologies of AI+AR are combined, their limitations, and their impacts in society. You’ll leave armed with code, inspiration, and an ethical framework for your own projects!
Artificial intelligence (AI) is used in a variety of industries for many applications. AI can be combined with other technologies to assist with understanding implications of certain aspects of applications. In this workshop, you explore how pose estimation results implemented using Deep Learning are impacted based on a location which is provided using augmented reality. These combined technologies provide insight into how poses could be interpreted differently based on a scene. This workshop also raises awareness regarding consequences of using AI for applications that are different from its originally intended use, which could lead to both technical and ethical challenges.
Specific topics that will be covered in this workshop are listed below:
• understand how AI and AR can be used for applications
• explore how to implement AI and AR
• discover what tools can be used to implement AI and AR
• review code that implements pose estimation using AI and changing background scenes using AR
• gain guidance regarding challenges to address societal impacts of the results from applications that use AI and AR
In addition to receiving an overview of terminology and an understanding of the workflows for each topic, code will be provided to demonstrate how to implement these workflows with tools from MathWorks.
This workshop was conducted by Louvere Walker-Hannon, Shruti Karulkar, & Sarah Mohamed from MathWorks.
Graph theory provides an effective way to study relationships between data points, and is applied to everything from deep learning models to social networks. This workshop is part I in a series of three workshops. Throughout the series we will progress from introductory explanations of what a graph is, through the most common algorithms performed on graphs, and end with an investigation of the attributes of large-scale graphs using real data.
And in particular for Part III:
Many of the systems we study today can be represented as graphs, from social media networks to phylogenetic trees to airplane flight paths. In this workshop we will explore real-world examples of graphs, discussing how to extract graphs from real data, data structures for storing graphs, and measures to characterize graphs. We will work with real examples of graph data to create a table of values that summarize different example graphs, exploring values such as the centrality, assortativity, and diameter of each graph. Python code will be provided so that attendees can get hands-on experience analyzing graph data.
This workshop was conducted by Stanford ICME PhD student, Julia Olivieri.
Graph theory provides an effective way to study relationships between data points, and is applied to everything from deep learning models to social networks. This workshop is part II in a series of three workshops. Throughout the series we will progress from introductory explanations of what a graph is, through the most common algorithms performed on graphs, and end with an investigation of the attributes of large-scale graphs using real data.
And in particular for Part II:
Graph-based algorithms are essential for everything from tracking relationships in social networks to finding the shortest driving distance on Google Maps. In this workshop we will explore some of the most useful graph algorithms, from both the breadth-first and depth-first methods for searching graphs, to Kruskal’s algorithm for finding a minimum spanning tree of a weighted graph, to approximation methods for solving the traveling salesman problem. We will use hands-on examples in python to explore the computational complexity and accuracy of these algorithms, and discuss their broader applications.
This workshop was conducted by Stanford ICME PhD student, Julia Olivieri.
In this workshop, we engage beginner and intermediate participants interested in getting started with Deep Learning and the Internet of Things (IoT). We’ll do hands-on exercises where you’ll use a webcam and a neural network to recognize images, aggregate data, and run real-time IoT analytics. Our goal is to get you excited about IoT and Deep Learning, and to set you up for success with various types of projects for work, school, and beyond.
This workshop was conducted by Louvere Walker-Hannon, Shruti Karulkar, & Sarah Mohamed from MathWorks.
Natural language processing has direct real-world applications, from speech recognition to automatic text generation, from lexical semantics understanding to question answering. In just a decade, neural machine learning models became widespread, largely abandoning the statistical methods due to its requirement of elaborate feature engineering. Popular techniques include use of word-embeddings to capture semantic properties of words. In this workshop, we take you through the ever-changing journey of neural models while addressing their boons and banes.
The workshop will address concepts of word-embedding, frequency-based and prediction-based embedding, positional embedding, multi-headed attention and application of the same in unsupervised context.
This workshop was conducted by Riyanka Bhowal, Senior Data Scientist at Walmart Gobal Tech.
In this workshop, Dora Demszky, a Stanford PhD student, illustrates how natural language processing (NLP) can be used to answer social science questions. The workshop will focus on applying NLP to analyze the content of 15 US history textbooks used in Texas, to analyze the representation of historically marginalized people and groups.
The workshop is based on a paper (https://journals.sagepub.com/doi/pdf/…) that also has an associated toolkit, and it will provide examples of how this toolkit can be used using a Jupyter notebook that will be made available.
Graph theory provides an effective way to study relationships between data points, and is applied to everything from deep learning models to social networks. This workshop is part I in a series of three workshops. Throughout the series we will progress from introductory explanations of what a graph is, through the most common algorithms performed on graphs, and end with an investigation of the attributes of large-scale graphs using real data.
And in particular for Part I:
Graphs are structures that represent pairwise connections, and are used for everything from finding the shortest route between two locations to google’s page rank algorithm. Are you interested in learning about graph theory but don’t know where to start? In this workshop we will introduce graphs, develop comfort with their associated terminology, and investigate real-world applications with a focus on intuitive explanations and examples.
This workshop was conducted by Stanford ICME PhD student, Julia Olivieri.
Want to learn more about trends like AI, IoT and wearable tech? In less than one hour, we will cut through the hype by building a “smart” fitness tracker using your own mobile device.
We’ll do hands-on exercises: you’ll acquire data from sensors, design a step counter and train a human activity classifier. You will leave motivated and ready to use machine learning and sensors in your own projects!
This workshop was conducted by Louvere Walker-Hannon, Shruti Karulkar, & Sarah Mohamed from MathWorks.
Parallel Computing 101: All you need to know about the hardware that powers data science | WiDS 2021
Cindy Orozco Bohorquez, Ph.D. Candidate at Stanford hosts a workshop on ‘Parallel Computing 101: All you need to know about the hardware that powers data science’.
Emily Miller, Senior Data Scientist at Drivendata.org hosts a workshop on ‘Actionable Ethics for Data Scientists’ in which she illustrates the different types of ethical concerns that arise in the course of data science work, grounding these in concrete examples of times where things have gone wrong.
Julia Ling, CTO at Citrine Informatics hosts a workshop on ‘Machine Learning for Scientific R&D: Why it’s Hard and Why it’s Fun’ in which she covers some of the key challenges in machine learning for R&D applications: the small, often-messy, sample-biased datasets; the exploratory nature of scientific discovery; and the curious, hands-on approach of scientific users. Julia discusses potential solutions to these challenges, including transfer learning, integration of scientific domain knowledge, uncertainty quantification, and machine learning model interpretability.
Zhamak Dehghani, Director, Emerging Technologies, North America at Thoughtworks hosts a workshop on ‘An introduction to Data Mesh: a paradigm shift in analytical data management’ in where Zhamak shares her observations on the failure modes of a centralized paradigm of a data lake, and its predecessor data warehouse. She introduces Data Mesh, a paradigm shift in big data management that draws from modern distributed architecture: considering domains as the first class concern, applying self-sovereignty to distribute the ownership of data, applying platform thinking to create self-serve data infrastructure, and treating data as a product.
Megan Price, Executive Director and Maria Gargiulo, Statistician with Human Rights Data Analysis Group (HRDAG) host a workshop on ‘Data Processing and Statistical Models to Impute Missing Perpetrator Information’ where they use methods from statistics and computer science to help answer questions about mass violence using incomplete and unrepresentative datasets from the context in which HRDAG works and how open-source tools are crucial to their analytical projects.
Have an opportunity to Meet-the-Speakers from WiDS Worldwide! Speaker Dina Machuve, Lecturer and Researcher at Nelson Mandela African Institution of Science and Technology is interviewed by Mahadia Tunga, Co Founder and Director Data Science, Research and Capacity Development of Tanzania Data Lab
Have an opportunity to Meet-the-Speakers from WiDS Worldwide! Speaker Fatima Abu Salem, Associate Professor at the American University of Beirut is interviewed by Lama Moussawi, Associate Dean for Research and Faculty Development at the American University of Beirut.

Have an opportunity to Meet-the-Speakers from WiDS Worldwide! Speaker Maria Schuld, Senior Researcher at University of KwaZulu-Natal is interviewed by Margot Gerritsen, Professor at Stanford University.

Best of WiDS features Timnit Gebru on her talk ‘Understanding the Limitations of AI: When Algorithms Fail’ from WiDS Stanford 2019!
Best of WiDS features Megan Price on her talk ‘Machine Learning to Determine How Many People Have Been Killed in Syria’ from Stanford 2017!
Best of WiDS features Madeleine Udell on her talk ‘Filling in Missing Data with Low Rank Models’ from WiDS Stanford 2019!
Emily Glassberg-Sands | Data Science for Unlocking Teaching & Learning at Scale | WiDS Stanford 2019
Best of WiDS features Emily Glassberg-Sands on her talk ‘Data Science for Unlocking Teaching & Learning at Scale’ from WiDS Stanford 2019!
Panel: Energy and Sustainability | Rosalind Archer, Xin Ma, Lesly Goh, Nida Rizwan Farid | WiDS 2021

Panel Discussion on ‘Energy and Sustainability’
Moderator: Rosalind Archer, Professor, University of Auckland
Panelists:
-Xin Ma, Managing Director, Asia Platform, TOTAL
-Lesly Goh, Senior Fellow, National University of Singapore Lee Kuan Yew School of Public Policy
-Nida Rizwan Farid, Aerospace Engineer and Energy Efficiency Consultant, Save Joules

Maria Schuld, Senior Researcher at Xanadu, and the University of KwaZulu-Natal provides an overview of quantum machine learning research and illustrate that quantum algorithms can be trained like neural nets, but look formally very similar to kernel methods.

Tsu-Jae King Liu, Dean of Berkeley School of Engineering at University of California, Berkeley delivers a Keynote presentation at WiDS Stanford University on March 2, 2020:
Today we live in a dynamic and unpredictable world that is increasingly dependent on engineered devices, processes and systems. A 2017 workforce report by the McKinsey Global Institute indicates that all workers will need to adapt as their occupations evolve with increasingly capable machines. In the age of artificial intelligence (AI) and data science, workers will spend more time on activities that require social and emotional skills, creativity, high-level cognitive capabilities and other skills that are relatively hard to automate.
There is growing evidence of the importance of a high emotional quotient (EQ) as a predictor of success and organizational performance. In this talk, Professor Liu will share insights gained from her personal career journey and describe initiatives being undertaken in the College of Engineering at the University of California, Berkeley to cultivate EQ in their students and to advance equity and inclusion, toward a brighter future for all.

Anima Anandkumar, Professor of Computing and Mathematical Sciences at CalTech and Director of Research in Machine Learning, NVIDIA.
Standard deep-learning algorithms are based on a function-fitting approach that do not exploit any domain knowledge or constraints. This makes them unsuitable in applications that have limited data or require safety or stability guarantees, such as robotics. By infusing structure and physics into deep-learning algorithms, we can overcome these limitations. There are several ways to do this. For instance, we use tensorized neural networks to encode multidimensional data and higher-order correlations. We infuse symbolic expressions into deep learning to obtain strong generalization. We utilize spectral normalization of neural networks to guarantee stability and apply it to stable landing of quadrotor drones. These instances demonstrate that building structure into ML algorithms can lead to significant gains.
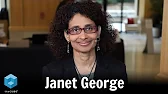
Janet George, “Fellow” Chief Data Officer/Scientist/Big Data/Cognitive Computing, Western Digital sits down with Lisa Martin at Stanford University for WiDS 2019.
#WiDS2019 #WesternDigital #theCUBE
https://siliconangle.com/2019/03/07/q…
Q&A: How AI is cultivating a responsible community to better mankind
Artificial intelligence initiatives powered by big data are propelling businesses beyond the capacity of human labor. While AI tech offers an undeniable opportunity for innovation, it has also sparked a debate around potential misuse through the vast reach of programmed biases and other problematic behaviors.
The power of AI can be comprehensively harnessed for good by fostering diverse teams focused on ethical solutions and working in tandem with policymakers to ensure responsible scale, according to Janet George (pictured), fellow and chief data officer at WD, a Western Digital Company.
George spoke with Lisa Martin (@LisaMartinTV), host of theCUBE, SiliconANGLE Media’s mobile livestreaming studio, during the Stanford Women in Data Science event in Stanford, California. They discussed the range of possibilities in AI and how WD is leveraging the technology toward sustainability.
[Editor’s note: The following answers have been condensed for clarity.]
Tell us about Western Digital’s continued sponsorship and what makes this important to you.
George: Western Digital has recently transformed itself … and we are a data-driven … data-infrastructure company. This momentum of AI is a foundational shift in the way we do business. Businesses are realizing that they’re going to be in two categories, the ‘have’ and the ‘have not.’ In order to be in the have category, you have to embrace AI … data … [and] scale. You have to transform yourself to put yourself in a competitive position. That’s why Western Digital is here.
How has Western Digital transformed to harness AI for good?
George: We are not just a company that focuses on business for AI. One of the initiatives we are doing is AI for Good and … Data for Good … working with the UN. We’ve been focusing on trying to figure out the data that impacts climate change. Collecting data and providing infrastructure to stow massive amounts of species data in the environment that we’ve never actually collected before. Climate change is a huge area for us, education … [and] diversity. We’re using all of these areas as a launching pad for Data for Good and trying to use data … and AI to better mankind.
Now we have the data to put out massively predictive models that can help us understand what the change would look like 25 years from now and take corrective action. We know carbon emissions are causing very significant damage to our environment and there’s something we can do about it. Data is helping us do that. We have the infrastructure, economies of scale. We can build massive platforms that can stow this data and then we can analyze this data at scale. We have enough technology now to adapt to our ecosystem … and be better in the next 10 years.
What are your thoughts on data scientists taking something like a Hippocratic Oath to start owning accountability for the data that they’re working with?
George: We need a diversity of data scientists to have multiple models that are completely diverse, and we have to be very responsible when we start to create. Creators have to be responsible for their creation. Where we get into tricky areas are when you are the human creator of an AI model, and now the AI model has self-created because it has self-learned. Who owns the copyright to those when AI becomes the creator? The group of people that are responsible for creating the environment, creating the models, the question comes into how do we protect the authors, the users, the producers, and the new creators of the original piece of art.
You can use the creation for good or bad. The creation recreates itself, like AI learning, on its own with massive amounts of data after an original data scientist has created the model. Laws have to change; policies have to change. Innovation has to go, and at the same time, we have to be responsible about what we innovate.
Where are we as a society in starting to understand the different principles and practices that have to be implemented in order for proper management of data to enable innovation?
George: We’re debating the issues. We’re coming together as a community. We’re having discussions with experts. What are we seeing as the longevity of that AI model in a business setting, in a non-business setting? How does the AI perform? We are now able to see the sustained performance of the AI model.
…
Watch the complete video interview below, and be sure to check out more of SiliconANGLE’s and theCUBE’s coverage of the Stanford Women in Data Science event.
Interview with Latanya Sweeney, Professor of Government and Technology in Residence, Harvard University
The Human Rights Data Analysis Group (HRDAG) uses methods from statistics and computer science to quantify mass violence. As part of that work, we rely on open source tools, including python and R, for data processing, management, analysis, and visualization. This talk will highlight how we use those methods and tools to estimate how many people have been killed in the ongoing conflict in Syria.
Megan Price, Human Rights Data Analysis Group
In this talk, I present results from a current project co-led by biologist Erwin Frise from Lawrence Berkeley National Lab (LBNL) to answer the fundamental systems biology question in the talk title. We design a lens to decompose spatial gene expression data into meaningful regions that can be used to, for example, automatically label image pixels and construct local gene networks. Our team consists of statisticians, biologists, and computer scientists, and we are also working on
crispr knock-out experiments and an open source software.
One of the challenges in big data analytics lies in being able to reason collectively about extremely large, heterogeneous, incomplete, and noisy interlinked data. We need data science techniques that can represent and reason effectively with this form of rich and multi-relational graph data. In this talk, I will describe some common inference patterns needed for graph data including: collective classification (predicting missing labels for nodes), link prediction (predicting potential edges), and entity resolution (determining when two nodes refer to the same underlying entity). I will describe some key capabilities required to solve these problems, and finally I will describe a highly scalable open-source probabilistic programming language being developed within my group to solve these challenges.
The vast ocean of data created in today’s digital world offers enormous potential. However, the key to unlocking that potential lies not in the data itself, but in the science that refines it. The well-defined processes and toolsets designed for legacy BI solutions do not meet the needs of today’s big data analytics environments. Diane will share Intel’s investments in both the technology and the ecosystem to enable the next breakthrough insights.